Assessment of Commercial Harvest
The Chippewas of Nawash Assessment Program samples an average of about 8000 individual fish per year from the Saugeen Ojibway commercial harvest. A sub-sample of the calcified structures collected is processed for production age and growth analysis in our laboratory. This page provides a generalized description of our processing procedures from collection to analysis. For more detailed documentation of our procedures please download our Manual of Standard Methods.
Field Data Collection:
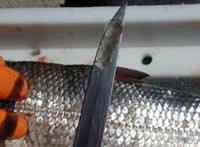
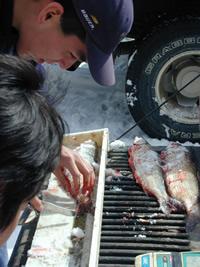
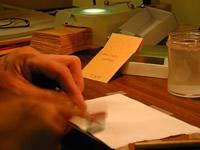
Statistical sampling rates have been set based on the work of Bruce Morison (2000). A random sub-sample of individuals is collected from each commercial landing and biological samples such as length, weight, and scales or both scales and otoliths are collected from each individual specimen. Scales are stored in labeled manilla coin envelopes and otoliths in Eppendorf tubes.
Sub-sampling:
Of the scales collected from a given individual in the field, three are then selected for analysis. Care must be taken at this stage to select scales that are similar in size and appearance, and are not regenerative or damaged.
Sample Preparation:
Scales and otoliths are cleaned using a mild solution of water and dish soap and scrubbed with a denture cleaning brush prior to mounting. Although time-consuming this process increases resolution drastically and allows for the capture of high quality clean images.
Mounting:
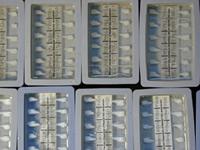
Once cleaned scales are then dried and mounted between two glass slides. If otoliths are to be analyzed using the crack and burn technique then they are dried, cracked through the focus and lightly charred using a paraffin smokeless candle. The cracked otoliths are then mounted in plasticine in the lid of a labeled Eppendorf tube. If otoliths are to be sectioned then samples from 10 individual pairs are embedded into a single polyester resin block in preparation for cutting.
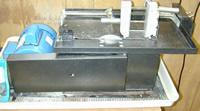
Sectioning:
CNCSAF uses the Raytech Al=P10S lapidary saw which is equipped with a 1/3 Hp motor that runs at 1725 rpm. The power feed moves the carriage at a rate of 25 cm per hour. We installed a 100mm diameter diamond impregnated blade with a thicknness of 0.23mm (Blue Blazer 4*0.006*0.009). We modified the saw to allow easy handling of resin blocks containing otoliths.
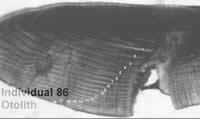
Sample Viewing:
Otoliths are viewed using a Fisher Scientific Micro-master scope with standard objectives, whereas scales are viewed using a Mitutoyo dissection scope using either 0.4 or 0.8 * magnifications.
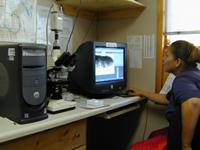
Image Capture and Storage:
These phases of the age determination process rely on Image Pro Express 4.0 software and a Hitachi Kp-D50U CCD Color Camera which can be moved between microscopes.
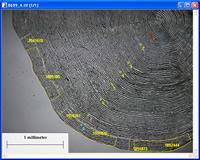
Analysis:
CGSAF employs digital imaging techniques to enhance scale features, quantify and tag image features, analyze image tagging data, and ultimately assign an age estimate in years to each individual fish. During analysis 25 random, unknown quadrant images are opened simultaneously using the Image Pro Express 4.0 software. The analysis process involves image enhancement and feature (checks, potential annuli and annual check) tagging. Tagging data are then exported to a Microsoft Excel spreadsheet where mean, median and mode, variance and statistical confidence are automatically calculated, and analyst tagging confidence is assigned to each image. A confidence ranking system is an integral part of the CGSAF age estimation process. It is a form of quality control that provides a powerful filter with defined thresholds to eliminate information that is not of superior quality. Confidence ranking occurs at two stages or levels of the age estimation process;
- individual image: accounts for image quality and confidence in tagging data, ranks the discernability of true annual checks for a given image
- age estimate: accounts for variation among tagging data from all images for a given individual and also considers the confidence ranks assigned to individual images.Analyst comments such as visual characterization of edge or perceived abnormalities, distinctiveness of scale features and overall image quality are also recorded on the spreadsheet. Once all of the images from the entire sample are enhanced and tagged, the data is then sorted and ages are estimated based on tagging data from all nine images and their associated confidence rankings.
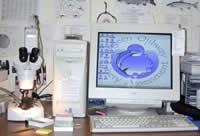
Image Analysis System Specifications:
Mitytoyo MSM-414L 1-4X Zoom Trinocular dissection microscope
Fisher Scientific Micro-master Compound microscope
Hitachi KP-D50 high-resolution 0.5 " color camera
Integral Technologies MV Flashpoint frame grabber
Dell dimension L667r computer with 30 GB storage
19" color monitor working at
Image Pro Express 4.0 software